Economy of France
| Economy of France | |
|---|---|
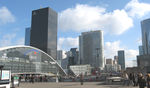 La Défense is a major business district in Paris |
|
| Rank | 5th (nominal) / 8th (PPP) |
| Currency | 1 euro (€1) = 100 cent |
| Fiscal year | Calendar year |
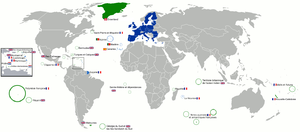
| Trade organisations | EU, WTO and OECD |
| Statistics | |
| GDP |
$2.113 trillion nominal : $2.635 trillion List of countries by GDP (nominal) |
| GDP growth | -2.1% (2008) [1] |
| GDP per capita | Nominal : $46,016 (2008) PPP : $32,800 (2009) |
| GDP by sector | agriculture (2.1%), industry (19%), services (78.9%) (2009 est) |
| Inflation (CPI) | 0.1% (2009 est.) |
| Population below poverty line |
6.2% (2004) |
| Gini index | 32.7 (2008) |
| Labour force | 27.99 million (2009 est.) |
| Labour force by occupation |
services (71.8%), industry (24.3%), agriculture (3.8%) (2009) |
| Unemployment | 10.1% (March 2010)[1] |
| Main industries | machinery, chemicals, automobiles, metallurgy, aircraft, electronics; textiles, food processing; tourism |
| Ease of Doing Business Rank | 31st[2] |
| External | |
| Exports | $456.8 billion (2009) |
| Export goods | machinery and transportation equipment, aircraft, plastics, chemicals, pharmaceutical products, iron and steel, beverages, electronics |
| Main export partners | Germany 14.7%, Spain 9.6, Italy 8.7%, United Kingdom 8.3%, United States 7.2%, Belgium 7.1% (2005) |
| Imports | $532.2 billion (2009) [2] |
| Import goods | machinery and equipment, vehicles, crude oil, aircraft, plastics, chemicals |
| Main import partners | Germany 18.9%, Belgium 10.7%, Italy 8.2%, Spain 7%, Netherlands 6.5%, United Kingdom 5.9%, United States 5.1% (2005) |
| FDI stock | $1.202 trillion (31 December 2009 est.) |
| Gross external debt | $5.021 trillion (30 June 2009) |
| Public finances | |
| Public debt | 79.7% of GDP (2009 est.) |
| Revenues | $1.229 trillion (2009 est.) |
| Expenses | $1.445 trillion (2009 est.) |
| Economic aid | donor: ODA $10.1 billion (2006) [3] |
| Foreign reserves | $102.9 billion (31 December 2008 est.) |
| Main data source: CIA World Fact Book All values, unless otherwise stated, are in US dollars |
|
- This article addresses the current economic situation of France. For historical information, see Economic history of France.
The economy of France is a mixed economy which is the fifth largest in the world in nominal terms, behind the United States, China, Japan and Germany [3] and the eighth largest by purchasing power parity. It is the second largest economy in Europe behind Germany in nominal terms[3] and fourth largest behind Germany, United Kingdom and Russia by PPP.[4] On May 15, 2009, the INSEE announced that France has officially entered a recession after its GDP decreased by 1.2% of Q1 in 2009.[5]
Contents |
Rise and decline of dirigisme
France embarked on an ambitious and very successful programme of modernization under state impulse and coordination. This program of dirigisme, mostly implemented by left-wing governments, involved the state control of certain industries such as transportation, energy and telecommunication infrastructures as well as various incentives for private corporations to merge or engage in certain projects.
However, dirigisme came to be highly contested after 1982 when newly elected socialist president François Mitterrand called for increased governmental control in the economy, nationalising many industries and private banks. By 1983, the government decided to renounce dirigisme and start the era of rigueur ("rigour") or corporatization. As a result the government largely retreated from economic intervention; dirigisme has now essentially receded though some of its traits remain.
Despite significant liberalisation over the past 15 years, the government continues to play a significant role in the economy: government spending, at 53% of GDP in 2001, is the highest in the G-7. Labour conditions and wages are highly regulated. The government continues to own shares in corporations in a range of sectors, including banking, energy production and distribution, automobiles, transportation, and telecommunications which differs from countries like the U.S or U.K where most of these companies are privatised?
Sectors of the economy
Industry
Leading industrial sectors in France are telecommunications (including communication satellites), aerospace and defense, ship building (naval and specialist ships), pharmaceuticals, construction and civil engineering, chemicals, and automobile production (3.5m units in 2005).
Research and development spending is also high in France at 2.26% of GDP, the fourth highest in the OECD.[6]
Energy
With no domestic oil production, France has relied heavily on the development of nuclear power, which now accounts for about 78% of the country's electricity production, up from only 8% in 1973, 24% in 1980, and 75% in 1990. Nuclear waste is stored on site at reprocessing facilities.
In 2006 of electricity in France amounted to 548.8 TWh, of which:[7]
- 428.7 TWh (78.1%) were produced by nuclear power generation
- 60.9 TWh (11.1%) were produced by hydroelectric power generation
- 52.4 TWh (9.5%) were produced by fossil fuel power generation
- 21.6 TWh (3.9%) by coal power
- 20.9 TWh (1.1%) by natural gas power
- 9.9 TWh (1.8%) by other fossil fuel generation (fuel oil and gases by-products of industry such as blast furnace gases)
- 6.9 TWh (1.3%) were produced by other types of power generation (essentially waste-to-energy and wind turbines))
- The electricity produced by wind turbines increased from 0.596 TWh in 2004, to 0.963 TWh in 2005, and 2.15 TWh in 2006, but this still accounts only for 0.4% of the total production of electricity (as of 2006).
Inflation rate 2003 1.80% 2004 2.10% 2005 2.30% 2006 1.70% 2007 1.50% 2008 1.50% 2009 2.80%
Privatisation of EDF
In November 2004, EDF (which stands for Electricité de France), the largest electricity provider in France, was floated on the French stock market, with the French State keeping more than 70% of the capital. EDF is not the only electricity provider in France. Other electricity providers include CNR (Compagnie nationale du Rhône) and Endesa (through SNET).
Agriculture
France is the European Union's leading agricultural producer, accounting for about one-third of all agricultural land within the EU. Northern France is characterized by large wheat farms. Dairy products, pork, poultry, and apple production are concentrated in the western region. Beef production is located in central France, while the production of fruits, vegetables, and wine ranges from central to southern France. France is a large producer of many agricultural products and is currently expanding its forestry and fishery industries. The implementation of the Common Agricultural Policy (CAP) and the Uruguay Round of the General Agreement on Tariffs and Trade (GATT) have resulted in reforms in the agricultural sector of the economy.
France is the world's sixth-largest agricultural producer and the second-largest agricultural exporter, after the United States[8]. However, the destination of 70% of its exports are other EU member states and many poor African countries (including its former colonies) which face serious food shortage. Wheat, beef, pork, poultry, and dairy products are the principal exports. The United States, although the second-largest exporter to France, faces stiff competition from domestic production, other EU member states, and third world countries. U.S. agricultural exports to France, totalling some $600 million annually, consist primarily of soybeans and products, feeds and fodders, seafood, and consumer oriented products, especially snack foods and nuts. French exports to the United States are mainly cheese, processed products and wine.
The French agricultural sector is heavily dependent upon subsidies from the European Union, which account for €11 billion. France is the main country in the EU that is against the reduction of subsidies. Subsidies have given France a competitive advantage which also demotes the concept of free trade. Specific government policies, such as the infamous reclassification of French wine as a 'health food' to avoid VAT, also goes a long way to create a thriving domestic sector.
Tourism

With 81.9 million foreign tourists in 2007,[9] France is ranked as the first tourist destination in the world, ahead of Spain (58.5 million in 2006) and the United States (51.1 million in 2006). This 81.9 million figure excludes people staying less than 24 hours in France, such as northern Europeans crossing France on their way to Spain or Italy during the summer. France features cities of high cultural interest (Paris being the foremost), beaches and seaside resorts, ski resorts, and rural regions that many enjoy for their beauty and tranquillity (green tourism). France also attracts many religious pilgrims to Lourdes, a town in the Hautes-Pyrénées département, that hosts a few million visitors a year.
Popular tourist sites include: (according to a 2003 ranking[10] visitors per year): Eiffel Tower (6.2 million), Louvre Museum (5.7 million), Palace of Versailles (2.8 million), Musée d'Orsay (2.1 million), Arc de Triomphe (1.2 million), Centre Pompidou (1.2 million), Mont-Saint-Michel (1 million), Château de Chambord (711,000), Sainte-Chapelle (683,000), Château du Haut-Kœnigsbourg (549,000), Puy de Dôme (500,000), Musée Picasso (441,000), Carcassonne (362,000).
Weapons industry
France is the fourth largest weapons supplier in the world. The French arms industry's main customer, for whom they mainly build warships, guns, nuclear weapons and equipment, is the French Government. Furthermore, record high defense expenditure (currently at €35 billion), which was considerably increased under the government of Prime Minister Jean-Pierre Raffarin, have contributed to the success of the French arms industries. In addition, external demand plays a big part in the growth of this sector: for example, France exports great quantities of weaponry to the United Arab Emirates, Brazil, Greece, India, Pakistan, Taiwan, Singapore and many others.
External trade
France is the second-largest trading nation in Europe (after Germany).[11] Its foreign trade balance for goods had been in surplus from 1992 until 2001, reaching $25.4 billion (25.4 G$) in 1998; however, the French balance of trade was hit by the economic downturn, and went into the red in 2000, reaching US$15bn in deficit in 2003. Total trade for 1998 amounted to $730 billion, or 50% of GDP—imports plus exports of goods and services. Trade with European Union countries accounts for 60% of French trade.
In 1998, U.S.-France trade totalled about $47 billion—goods only. According to French trade data, U.S. exports accounted for 8.7%--about $25 billion—of France's total imports. U.S. industrial chemicals, aircraft and engines, electronic components, telecommunications, computer software, computers and peripherals, analytical and scientific instrumentation, medical instruments and supplies, broadcasting equipment, and programming and franchising are particularly attractive to French importers.
The principal French exports to the United States are aircraft and engines, beverages, electrical equipment, chemicals, cosmetics, luxury products and perfume. France is the ninth-largest trading partner of the U.S.
Regions economy
The economic disparity between French regions is not as high as that in other European countries such as Spain, Italy or Germany.
The most important regions are Ile-de-France (4th agglomerations for her economy in the world), Rhônes-Alpes (6th economic European region thanks to its services, high-technologies, chimical industries, wines, tourism), Provence-Alpes-Côtes d'Azur (services, industry, tourism and wines), Nord-Pas-de-Calais (industries) and Pays de la Loire.
Regions like Alsace, which has a rich past in industry (machine tool), are relatively wealthy without ranking very high in absolute term.
The rurals area are mainly in Auvergne, Limousin, and Centre, and wines productions account for a significant amount of the economy in Aquitaine (Bordeaux region), and champagne for Champagne-Ardennes. List of French regions ranked by GDP total and per capita.
| Rank | Region | GDP (in millions euros, 2005) |
GDP per capita (euros, 2005) |
|---|---|---|---|
| 1 | Île-de-France | 480,870 | 42,712 |
| 2 | Rhône-Alpes | 165,034 | 28,131 |
| 3 | Provence-Alpes-Côte d'Azur | 120,365 | 25,693 |
| 4 | Nord-Pas de Calais | 86,747 | 21,555 |
| 5 | Pays de la Loire | 84,990 | 25,401 |
| 6 | Aquitaine | 76,895 | 25,374 |
| 7 | Brittany | 73,511 | 24,443 |
| 8 | Midi-Pyrénées | 67,486 | 25,140 |
| 9 | Centre | 61,968 | 25,005 |
| 10 | Languedoc-Roussillon | 53,197 | 21,752 |
| 11 | Lorraine | 53,013 | 22,769 |
| 12 | Alsace | 46,870 | 26,196 |
| 13 | Upper Normandy | 44,864 | 24,923 |
| 14 | Picardie | 41,276 | 22,022 |
| 15 | Poitou-Charentes | 39,286 | 23,311 |
| 16 | Bourgogne | 38,733 | 23,880 |
| 17 | Champagne-Ardenne | 33,550 | 25,093 |
| 18 | Lower Normandy | 33,253 | 23,099 |
| 19 | Auvergne | 30,632 | 23,127 |
| 20 | Franche-Comté | 27,016 | 23,782 |
| 21 | Régions d'outre-mer (2002) | 22,891 | 13,375 |
| 22 | Limousin | 16,326 | 22,664 |
| 23 | Corsica | 5,846 | 21,508 |
Source : INSEE.
Departements economy and cities
In terms of income, important inequalities can be observed among the French "départements". According to the 2008 statistics of the INSEE, the Yvelines is the richest département of the country with an average household income of €3,750 per month. Hauts-de-Seine comes second, Essonne third, Paris fourth, Seine-et Marne fifth. Ile-de-France is the richest region in the country with an average household income of €3,228 per month compared to €2 478 on a national level. Alsace comes second, Rhône-Alpes third, Picardie fourth, Haute-Normandie fifth. There were 280,000 US dollar millionaires living in France in 2010, or about 0.45% of the total population[12].
On the contrary, French overseas territories are the poorest parts of France, Guyanne being the poorest "département" with an average household income of €1,826. In metropolitan France, it is Creuse, in the Limousin region, which comes bottom of the list with an average household income of €1,849 per month.[13]
Huge inequalities can also be found among cities. In the Paris metropolitan area, significant differences exist between the higher standard of living of some western suburbs and lower standard of living areas in the north of Paris. For cities of over 50,000 inhabitants, Neuilly-sur-Seine, a western suburb of Paris, is the most prosperous city in France with an average household income of €5,434, and 20% earning more than €8,000 per month[14].
In Paris, three districts have comparable level of incomes per household : the 7th, the 8th and the 16th "arrondissement". The 8th "arrondissement" is the richest district in Paris and is surpassing Neuilly-sur-Seine in household income. Aubervilliers and La Courneuve incomes are among the poorest of France. In Aubervilliers, average householf income is about €1,840 per month. The 2005 riots took place in this part of the Paris metropolitan area.
Notes and references
- ↑ Euro area unemployment rate at 10.0% - Eurostat. 30. April 2010
- ↑ "Doing Business in France 2010". World Bank. http://www.doingbusiness.org/ExploreEconomies/?economyid=70. Retrieved 2010-08-20.
- ↑ 3.0 3.1 "Gross domestic product 2008". World Bank. http://siteresources.worldbank.org/DATASTATISTICS/Resources/GDP.pdf. Retrieved 2010-03-01.
- ↑ https://www.cia.gov/library/publications/the-world-factbook/rankorder/2001rank.html
- ↑ http://www.france24.com/en/20090515-france-officially-hit-recession-gdp-negative-growth-economic-crisis
- ↑ "France in the United States: Economy". Embassy of France in Washington. http://www.ambafrance-us.org/spip.php?article511. Retrieved 23 April 2010.
- ↑ Source: L’Electricité en France en 2006 : une analyse statistique
- ↑ (French) L'Agriculture en chiffres
- ↑ "Le tourisme international en France en 2007" (PDF). Direction du Tourisme (French government's tourism agency). http://www.tourisme.gouv.fr/fr/z2/stat/tis/att00018288/TIS_EVE2007_2008-5.pdf. Retrieved 2008-06-05. (French)
- ↑ "Musées et Monuments historiques". http://www2.culture.gouv.fr/deps/mini_chiff_03/fr/musee.htm.
- ↑ "Leading exporters and importers in world merchandise trade, 2007". World Trade Organization. http://www.wto.org/english/res_e/statis_e/its2008_e/section1_e/i08.xls. Retrieved 2009-06-03.
- ↑ http://images.businessweek.com/ss/10/06/0615_global_millionaires/9.htm
- ↑ http://www.salairemoyen.com/departement.php?dept=23
- ↑ http://www.salairemoyen.com/revenus.php?Commune=92051&Ville=92200+-+NEUILLY+SUR+SEINE
See also
- France
- Economic history of France
- Economy of Paris
- Poverty in France
- Economy of Europe
- Economy of the European Union
External links
- Official French exporters directory - Firmafrance.com is the Official French exporters B2B directory, powered by Ubifrance and officially endorsed by the Ministry of the Economy, Finance and Industry of France.
- OECD's France country Web site and OECD Economic Survey of France
- French National Institute for Statistics and Economic Studies (INSEE)
- Xerfi ( Xerfi) - French private economic report institute
- Investing in French Stocks - Nov, 2006 Global investor commentary on the current state of French stocks.
- The French Revolution of 2007 - Nicholas Vardy March 9, 2007 - Investor perspective on changes affecting French markets and economy.
|
|||||
|
|||||
|
||||||||||||||
|
||||||||||||||||